Screenshots
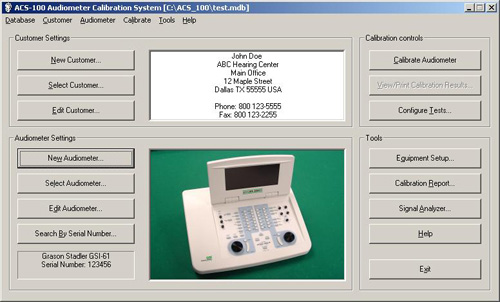
The screenshot below is of the main application window.
The selected customer information is conveniently shown along with
an image of the selected audiometer. The right side buttons
are where you configure the tests and start the calibration.
It
exceptionally easy to use.
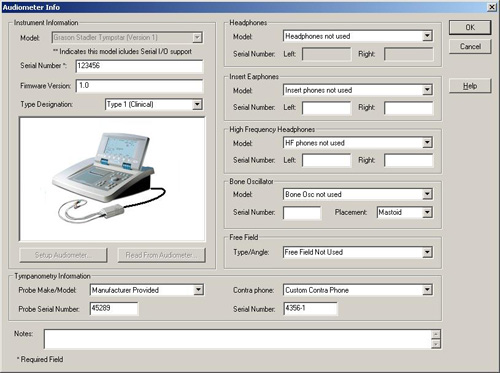
The screenshot below is where you enter the
audiometer information. This is where you select the
audiometer model and specify the transducers.
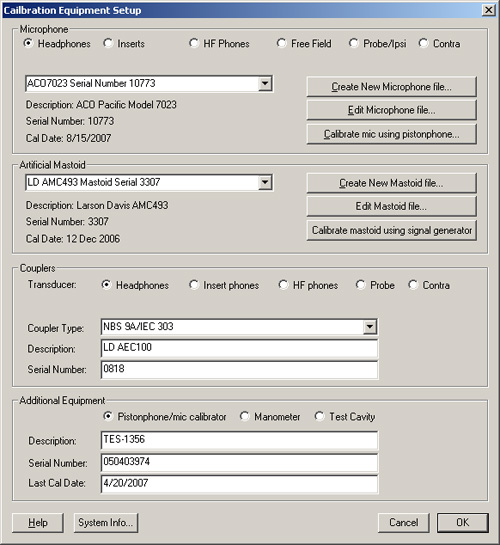
The Equipment Setup screen is where you specify
your microphone, coupler and artificial mastoid parameters.
From here you can also calibrate your microphone using a mic
calibrator or pistonphone.
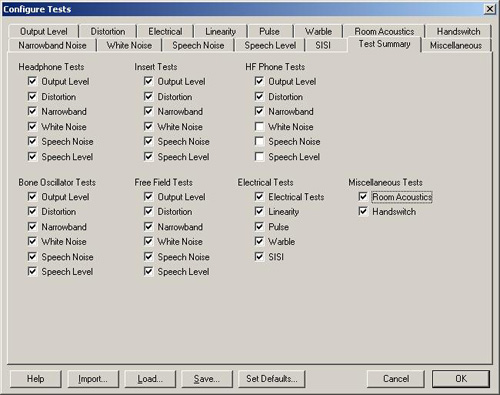
The Test Configuration screen allows you to
customize each and every test point that is used. Although
there are many parameters available, the system contains defaults
for all the supported audiometers. In addition, you can also easily save
and load entire test configurations from disk - this greatly
simplifies any custom test setups.
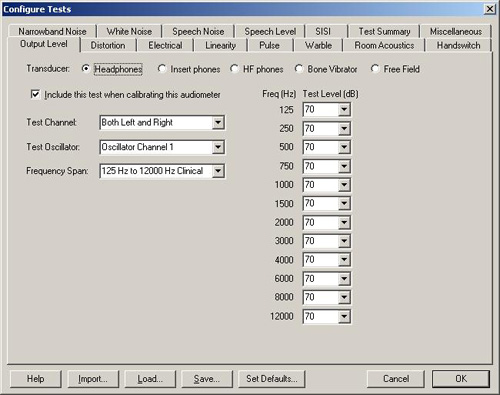
Here is a sample of the configuration options for
the Output Level test. You can set the individual hearing test
levels for each frequency as needed as well as the channels and
frequency span to test.
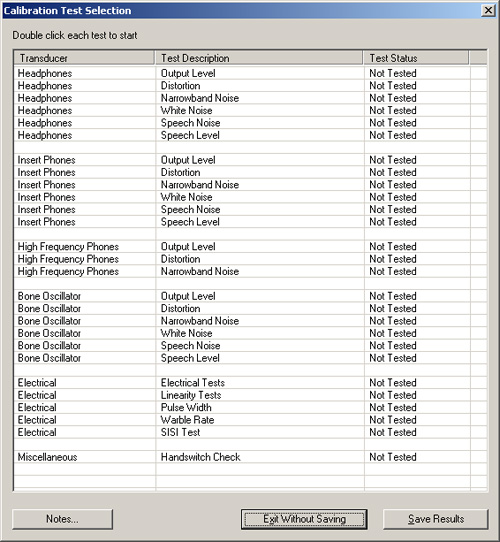
This is the main calibration control panel for type 1 or 2 audiometers.
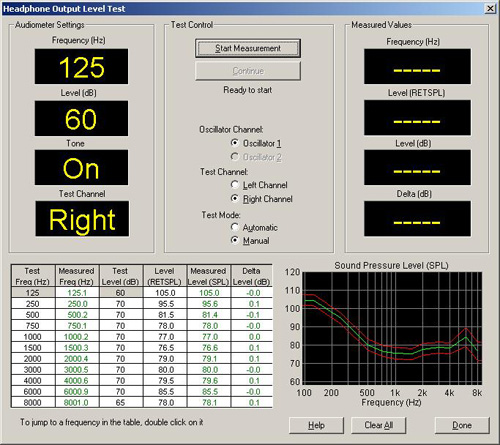
The screenshot below is of the output level test. The left side indicators prompt you to set the audiometer frequency, level and channel and the right side indicators display the measured values, target level and difference. The results are shown in the table and plotted on the graph. Out of spec values are shown in red.
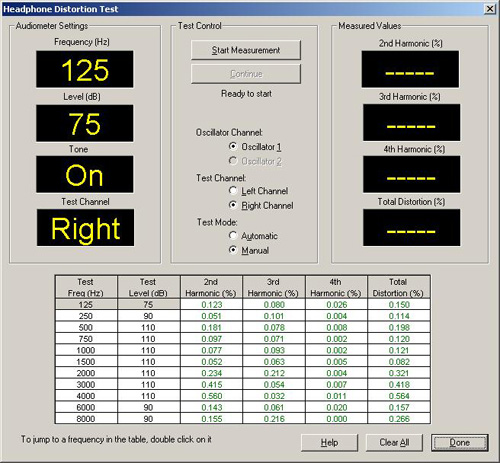
The screenshot below shows the distortion test.
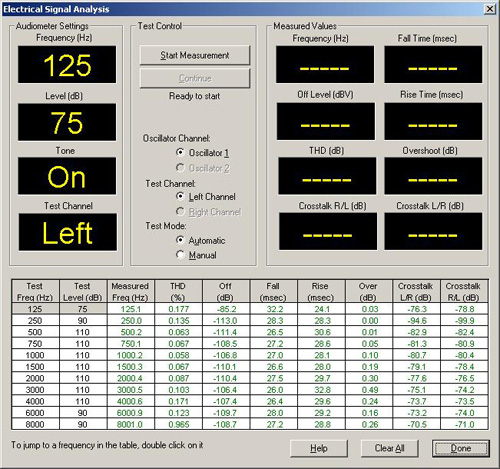
The screen below shows the electrical test screen. This test performs a battery of measurements including rise, fall, and overshoot quickly and efficiently. These tests are performed using a resistive load in place of the transducer - all load switching is automatically controlled by the calibration system.
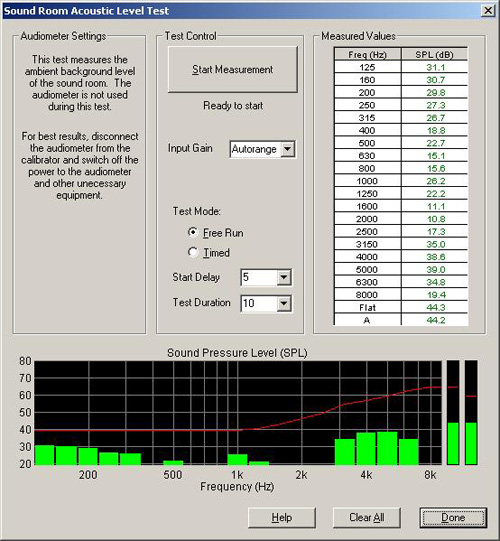
This screen shows the room acoustic test panel. You can set a start delay and test duration to allow you to exit the room during the measurement.
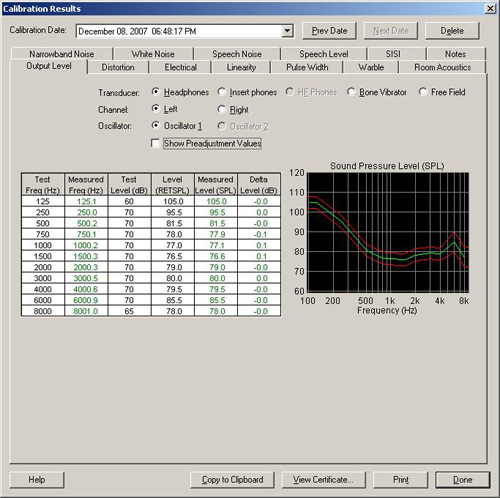
This screenshot below is where you can view the test results. Individual tabs select the test and individual radio buttons select the transducer. The "Show Preadjustment Values" checkbox allows you to view the values before any adjustments were made. Buttons at the top allow you to page through previous calibrations for this audiometer which can be helpful for spotting trends. Buttons on the bottom allow you to copy the data to the clipboard for pasting into Excel or Word.
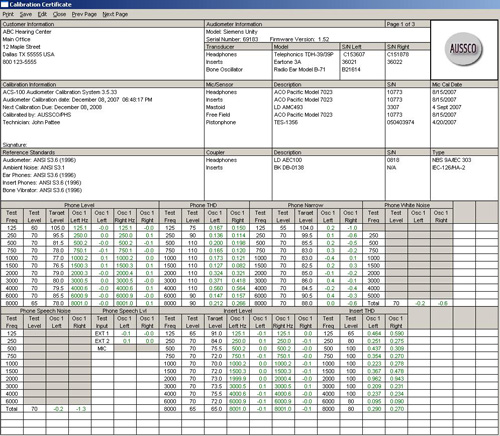
The screenshot below shows the first page (there may be multiple pages depending on the audiometer and transducer configuration) of the calibration certficate. The logo in the upper right can be customized to show your company logo. Any out of spec values are shown in red.
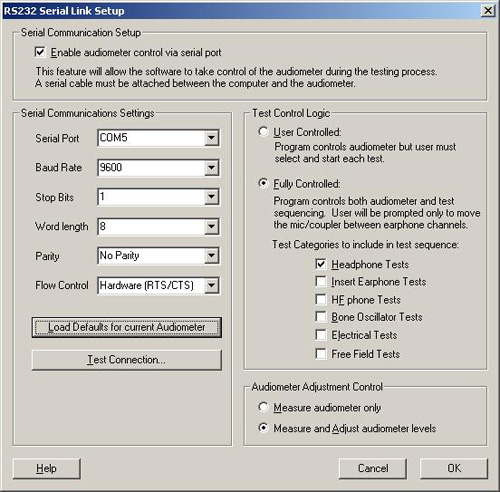
This dialog box is shown for all audiometers that the ACS can control via an RS232 Serial Link (or USB in some cases).
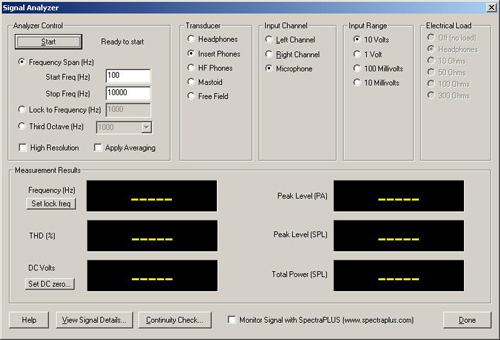
This screen shot shows the built-in Signal Analyzer utility. This allows you to manually make measurements using the system. Measurements include SPL levels, Frequency, THD, DC levels, and Force levels. Frequency span controls, averaging setting, and a total power readout allow you to measure noise type signals. Real time graphing of the spectrum can be performed using the SpectraPLUS FFT spectrum analysis package (optional).